“Capitalism has now singled out a handful (less than one-tenth of the inhabitants of the globe; less than one-fifth at a most “generous” and liberal calculation) of exceptionally rich and powerful states which plunder the whole world simply by “clipping coupons.””
V.I. Lenin – Preface to the French and German editions of ‘Imperialism, the Highest Stage of Capitalism’ (1920)
In a 1976 article, Arghiri Emmanuel illustrated the extent of the “bourgeoisization” of the proletariat in the rich countries with a simple thought experiment:
- The average annual salary of a U.S. worker was $10,500 (this and the following data express nominal 1973 dollars).
- The total population of the capitalist world then amounted to 2.6 billion people.
- Remunerating the entire population of the capitalist world at the average wage of the average U.S. worker would have required some $11 trillion annually.
- However, the total national income of the capitalist world amounted to only $2.7 trillion annually.
- If all the world’s annual income – eliminating the parasitic counterparts of labor: profit, rent, interest rates, etc. – had been destined to simple reproduction, and thus distributed equally among the entire world population, it would have been enough to cover just a quarter of the U.S. wage: that is, about $2,500 per capita per year.
From this, Emmanuel inferred that the international proletariat was split. The metropolitan part enjoyed certain benefits derived from the exploitation of poor countries, and therefore had an objective interest in the perpetuation of this system. The peripheral part, on the other hand, was subjected to a stark exploitation which not only (and not so much, for Emmanuel) defrayed the profits of the imperialist bourgeoisie, but also a substantial part of rich countries’ labor aristocracy’s income.
What are the results of Emmanuel’s thought experiment as applied to the present?
- The average U.S. national income per capita in 2021 is $70,480 per year (this and the following figures express 2023 international dollars).
- The total world population is 7.888 billion people.
- Repaying the entire world’s population with the average income of a U.S. citizen would require about $556 trillion annually.
- However, the total national income of the entire world amounts to just $146 trillion annually.
- If all the world’s annual income – eliminating the parasitic counterparts of labor: profit, rent, interest rates, etc. – was used for simple reproduction, and thus distributed equally among the entire world population, it would be enough to cover barely a quarter of the average U.S. income: that is, about $18,510 per capita per year.
To broaden the focus, we can apply the same reasoning, not only to the United States, but to the rich nations as a whole. We follow the World Bank’s classification of high-income countries:
- The average national income per capita in high-income countries in 2021 is $55,225 per year (this and the following figures are in 2023 international dollars).
- The total world population is 7.888 billion people.
- Repaying the entire world’s population with the average income of the average citizen in high-income countries would require about $436 trillion per year.
- However, the total national income of the entire world amounts to just $146 trillion annually.
- If all the world’s annual income – eliminating the parasitic counterparts of labor: profit, rent, interest rates, etc. – was destined to simple reproduction, and thus distributed equally among the entire world population, it would be enough to cover barely one third of the average income of high-income countries: that is, about $18,510 per capita per year.
Lenin, more than a century ago, referred to the imperialist powers as “a handful (less than one-tenth of the inhabitants of the globe; less than one-fifth at a most “generous” and liberal calculation) of exceptionally rich and powerful states which plunder the whole world simply by “clipping coupons”.”. In other words, oppressor nations accounted for between 10 and 20% of the world’s population. Today, the population of high-income countries amounts to 1.24 billion people: 15.7% of the world total. We can therefore conclude that Lenin’s diagnosis – and, in the same vein, as we have already seen, also that of Emmanuel – is still valid.
But there is another way, even more precise than this general calculation, to illustrate the magnitude of the “bourgeoisization” of the proletariat of the rich countries.
According to the Poverty and Inequality Platform (PiP) of the World Bank, the average per capita consumption or income of the entire world population amounts, in 2019, to $18.04 per day (this figure and the following ones express 2017 international dollars, according to the World Bank’s purchasing power parity adjustment). Therefore, the average consumption or income of the entire world population is equivalent to about $140 trillion per day. If, as in Emmanuel’s hypothesis, tomorrow world socialism were to be implemented by decree, redistributing all the daily income equally, which part of the world population would benefit from this redistribution? Which part, on the contrary, would be harmed?
PiP provides income or consumption data disaggregated by country and percentile, allowing a relatively accurate calculation of this magnitude. Assuming that neither the international – i.e., between countries – nor the national – i.e., between classes – distribution of income or consumption has changed significantly between 2019 and 2021, we find that 74% of the world’s population would benefit from an equal redistribution of total world income, while the remaining 26% would be disadvantaged.
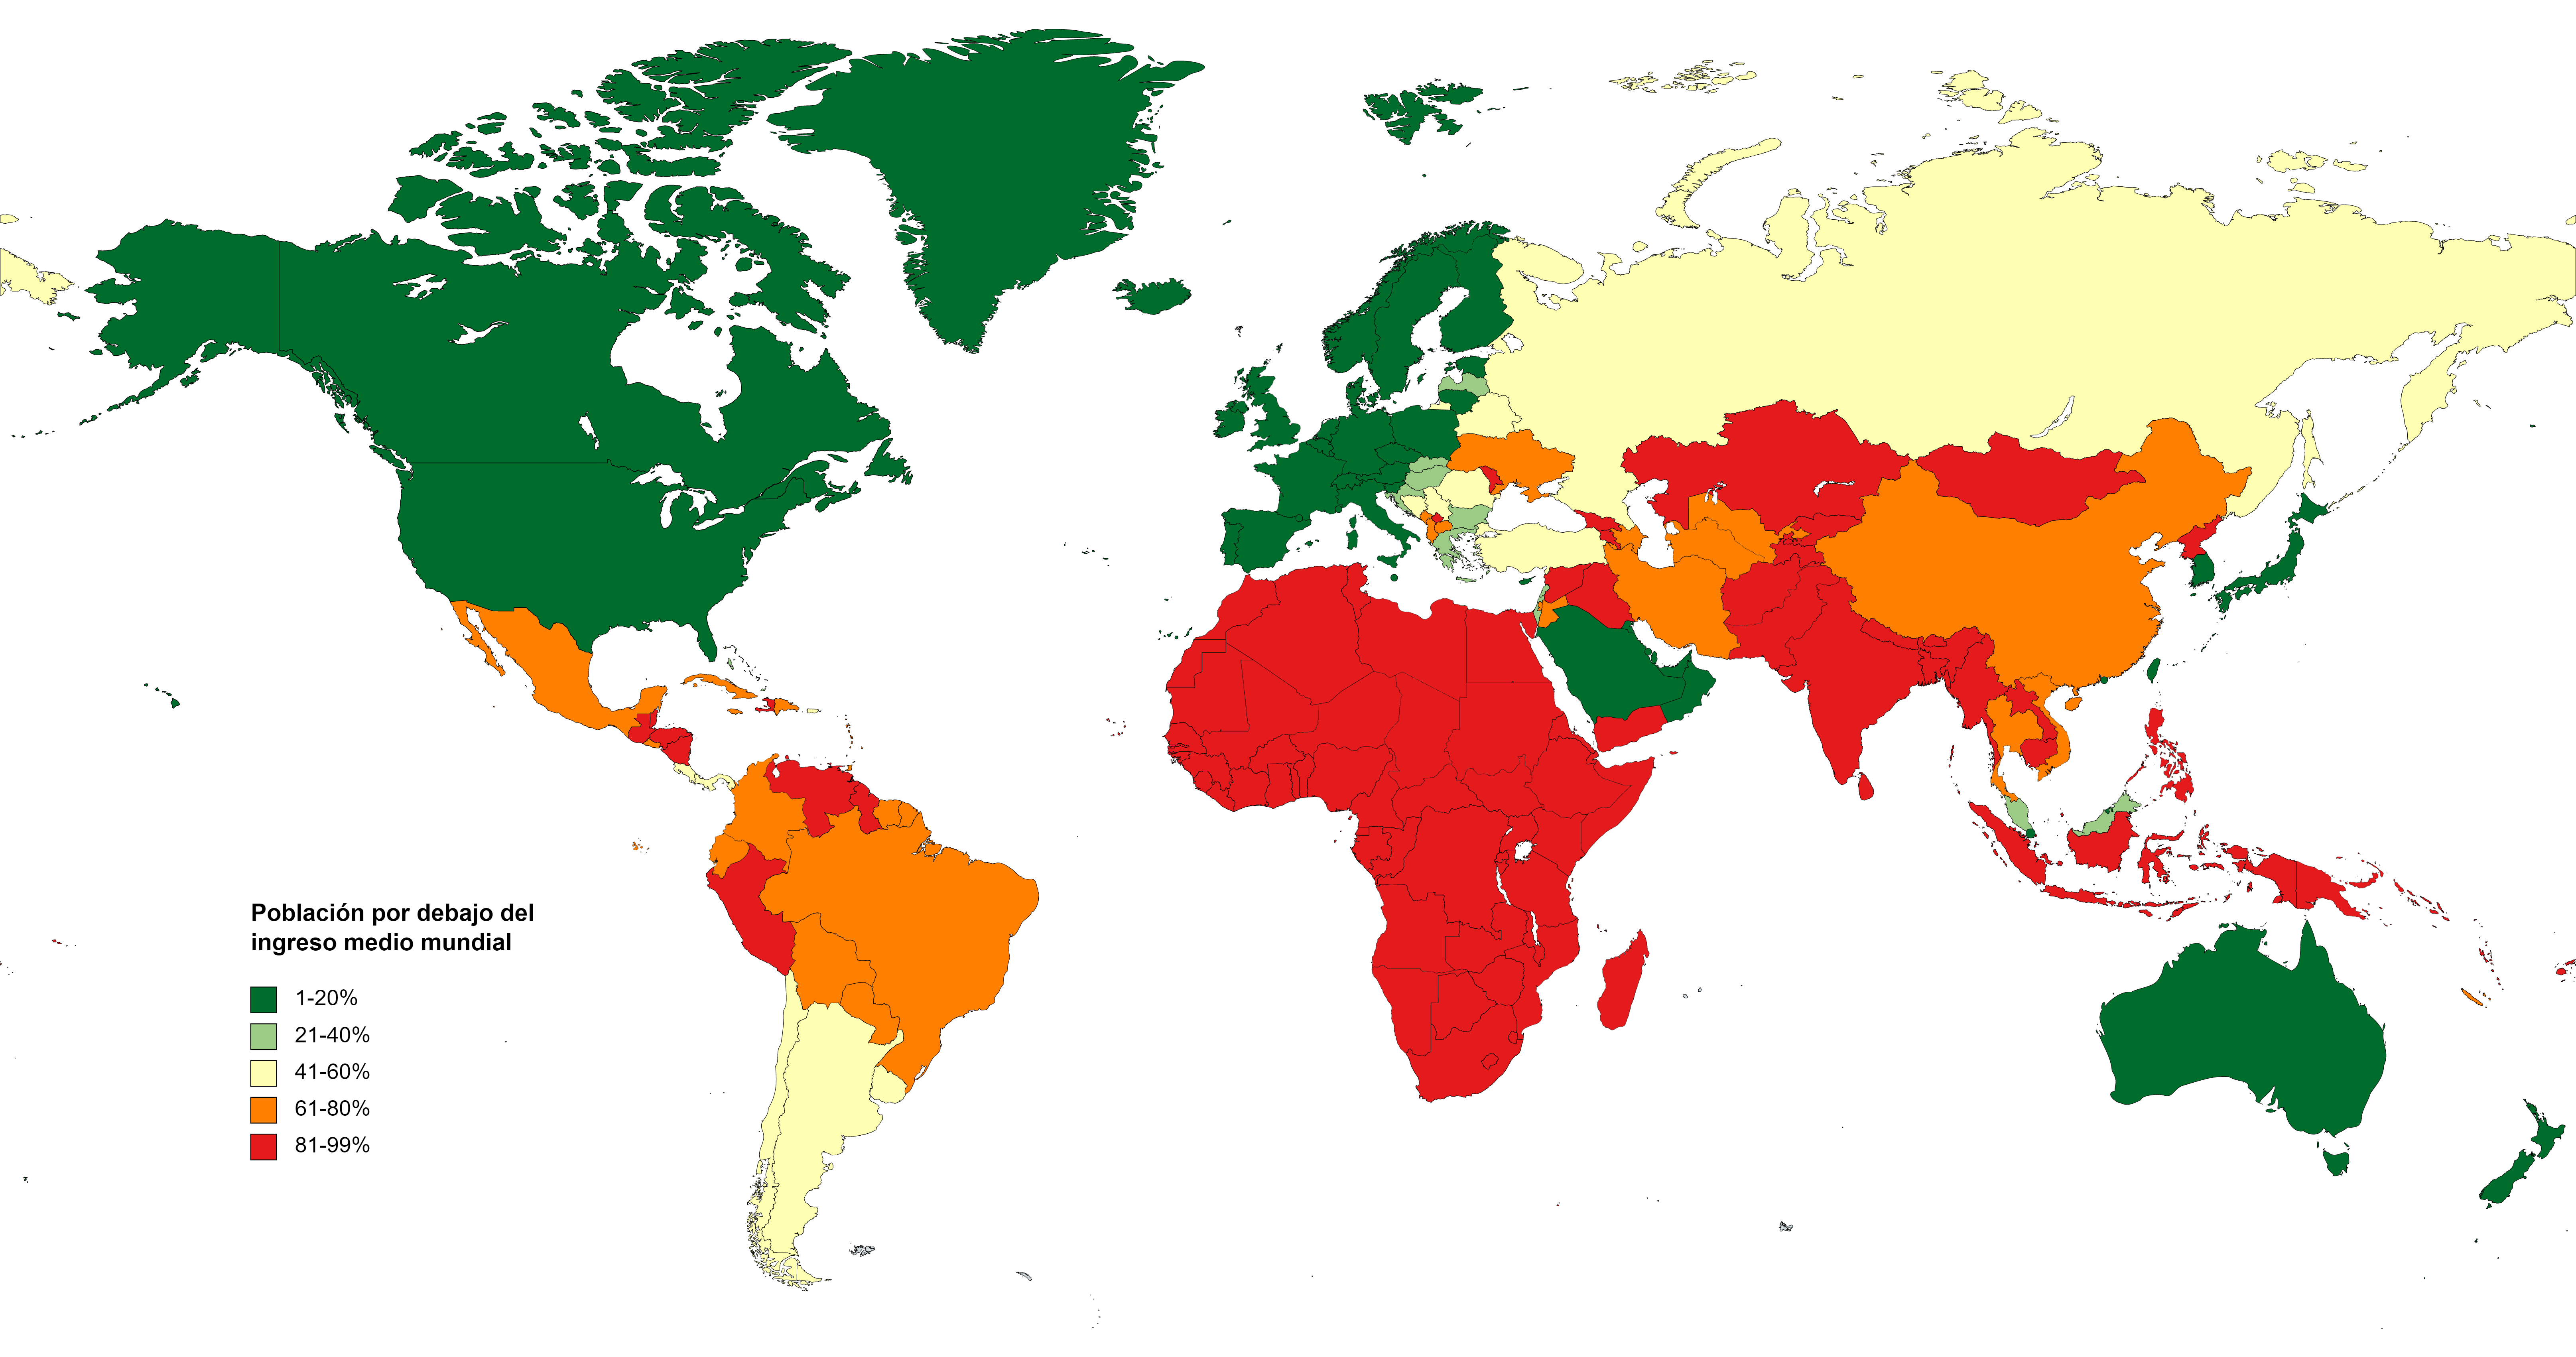
Calculating by country, we obtain the following result:
 1. PERCENTAGE OF NATIONAL POPULATION ABOVE/BELOW WORLD AVERAGE INCOME OR CONSUMPTION
Countries where the majority of the population has income or consumption levels below the world average – that is, where more than 50% of the population lives on less than $18.04 per day – account for 83% of the world’s population. In contrast, countries where a large majority of the population shows income or consumption levels above the world average – that is, where more than 85% of the population lives above $18.04 per day – account for only 14% of the world’s population.
How are these two groups distributed among the different world regions?
- Sub-Saharan Africa is home to 1.182 billion people. Of these, 1.155 billion (about 98%) would benefit from an equal redistribution of the world’s wealth, while only 27 million (just over 2%) would see their income levels worsen.
- South Asia is home to 1.902 billion people. Of these, 1.861 billion (about 98%) would benefit from an equal redistribution of the world’s wealth, while only 41 million (just over 2%) would see their income levels worsen.
- Excluding high-income countries, Latin America and the Caribbean is home to 621 million people. Of these, 457 million (around 74%) would benefit from an equal redistribution of global wealth, while 164 million (just over 26%) would see their income levels worsen.
- Excluding high-income countries, East Asia and the Pacific is home to 2.124 billion people. Of these, 1.696 billion (about 80%) would benefit from an equal redistribution of global wealth, while 428 million (just over 20%) would see their income levels worsen.
- Central Asia and Eastern Europe are home to 402 million people, excluding high-income countries. Of these, 267 million (just over 66%) would benefit from an equal redistribution of global wealth, while 135 million (around 34%) would see their income levels worsen.
- North Africa and the Middle East are home to 417 million people, excluding high-income countries. Of these, 367 million (88%) would benefit from an equal redistribution of the world’s wealth, while only 50 million (12%) would see their income levels worsen.
- High-income countries – excluding micro-states with less than 1 million inhabitants – are home to 1.235 billion people. Of these, only 104 million (barely 8%) would benefit from an equal redistribution of the world’s wealth, while 1.132 billion (around 92%) would see their income levels worsen.
In short: an overwhelming majority of the population of Asia, Africa and Latin America – in addition to a substantial part of the population of Eastern Europe and Oceania – would undoubtedly improve under the assumption of a redistribution of world income. This sector therefore has a more or less obvious objective interest in ending the prevailing economic relations. In contrast, an overwhelming majority of the populations of Europe, North America, Australasia and Japan show income levels above those that would correspond to them under our hypothetical scenario of an international redistribution of wealth. This sector therefore has a more or less obvious objective interest in maintaining the functioning of prevailing economic relations.
On the other hand, how are the different countries distributed within this global income hierarchy?

2. PERCENTAGE OF NATIONAL POPULATION BELOW WORLD AVERAGE INCOME OR CONSUMPTION
- Countries with less than 20% of the population below the world average income include the United States and Canada, Australia and New Zealand, Japan, South Korea, Taiwan, Western Europe, the Nordic countries, some Eastern European countries, the Persian Gulf monarchies and a number of micro-states that operate as tax havens. Together they account for 14% of the world’s population.
- Countries with between 21% and 40% of the population below the world average income include Israel, Lebanon, Malaysia, Greece and some Eastern European countries. Together, these countries account for less than 2% of the world’s population.
- Countries with between 41% and 60% of the population below the world average income include Argentina, Chile, Uruguay, Costa Rica, Panama, some Eastern European countries, Russia and Turkey. Together they account for about 4% of the world’s population.
- Countries with between 61% and 80% of the population below the world average income include much of Latin America, some Eastern European and Central Asian countries, China, Vietnam and Thailand. Together they account for 21% of the world’s population.
- Countries with between 81% and 99% of the population below the world average income include some Latin American countries, the entire African continent, Moldova and Kosovo, some countries in the Middle East and Central Asia, the entire Indian subcontinent and most of the Indo-Pacific countries. Together, these countries account for almost 59% of the world’s population.
This distribution shows two clearly differentiated strata. On the one hand, a minority of rich countries whose population enjoys, almost entirely, living conditions superior to those of the rest of humanity. On the other hand, a vast majority of poor countries whose population survives almost entirely on income levels below the world average. Among them is a tiny “transition” segment, where 71% of the population is concentrated in just four countries (Argentina, Malaysia, Russia and Turkey).
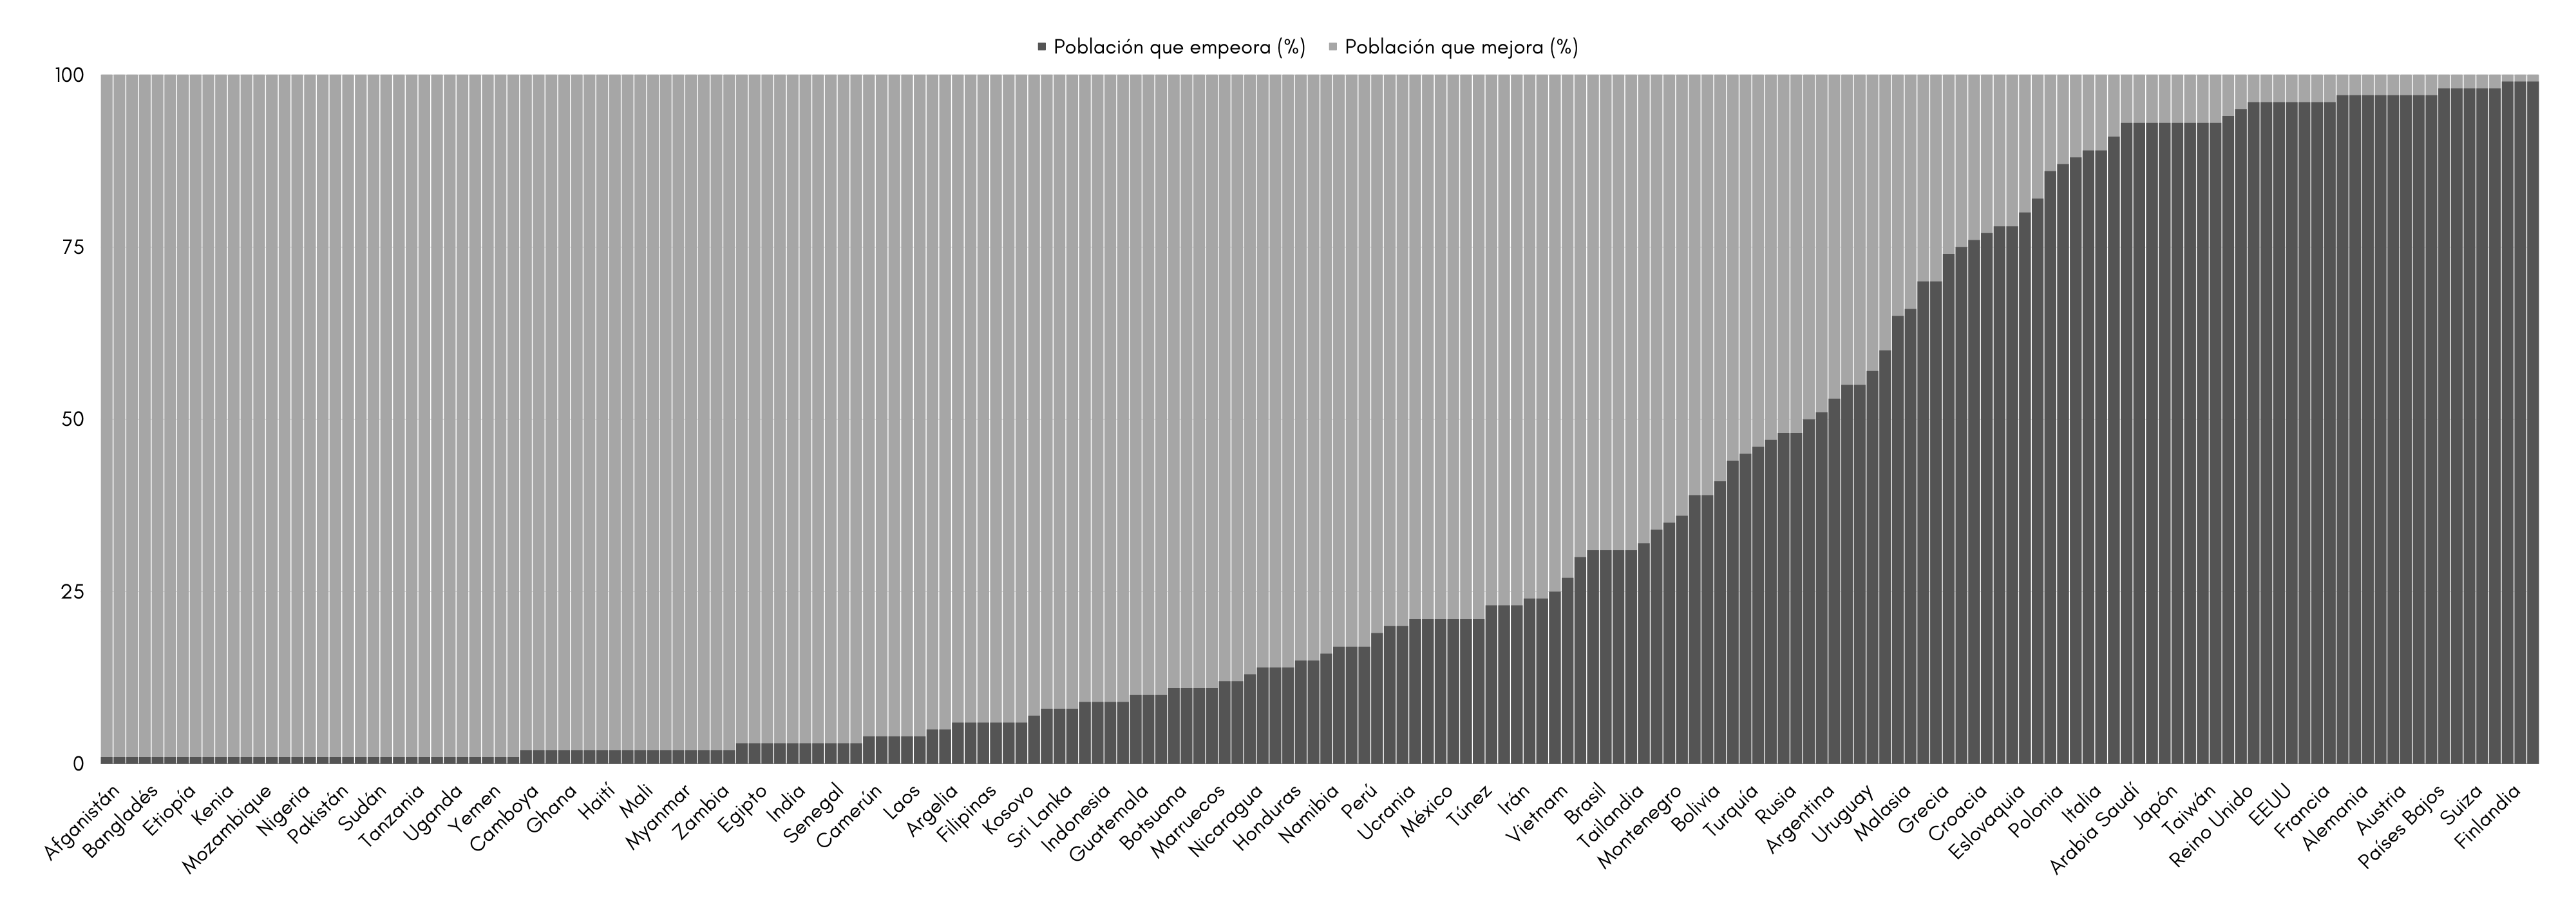
In short, apart from the various micro-states that function as tax havens, there are only about thirty countries in the world where less than 15% of the population would gain from an international redistribution of wealth. The following graph shows this percentage for a number of leading countries, which together constitute the dominant pole of the world capitalist economy:
3. PERCENTAGE OF THE NATIONAL POPULATION BELOW WORLD AVERAGE INCOME OR CONSUMPTION
In most of these countries, the percentage of the population with an income below the world average does not even reach 5%. Moreover, this select club of rich countries has not only a population almost entirely above the world average income, but also social majorities that earn at least twice that amount:
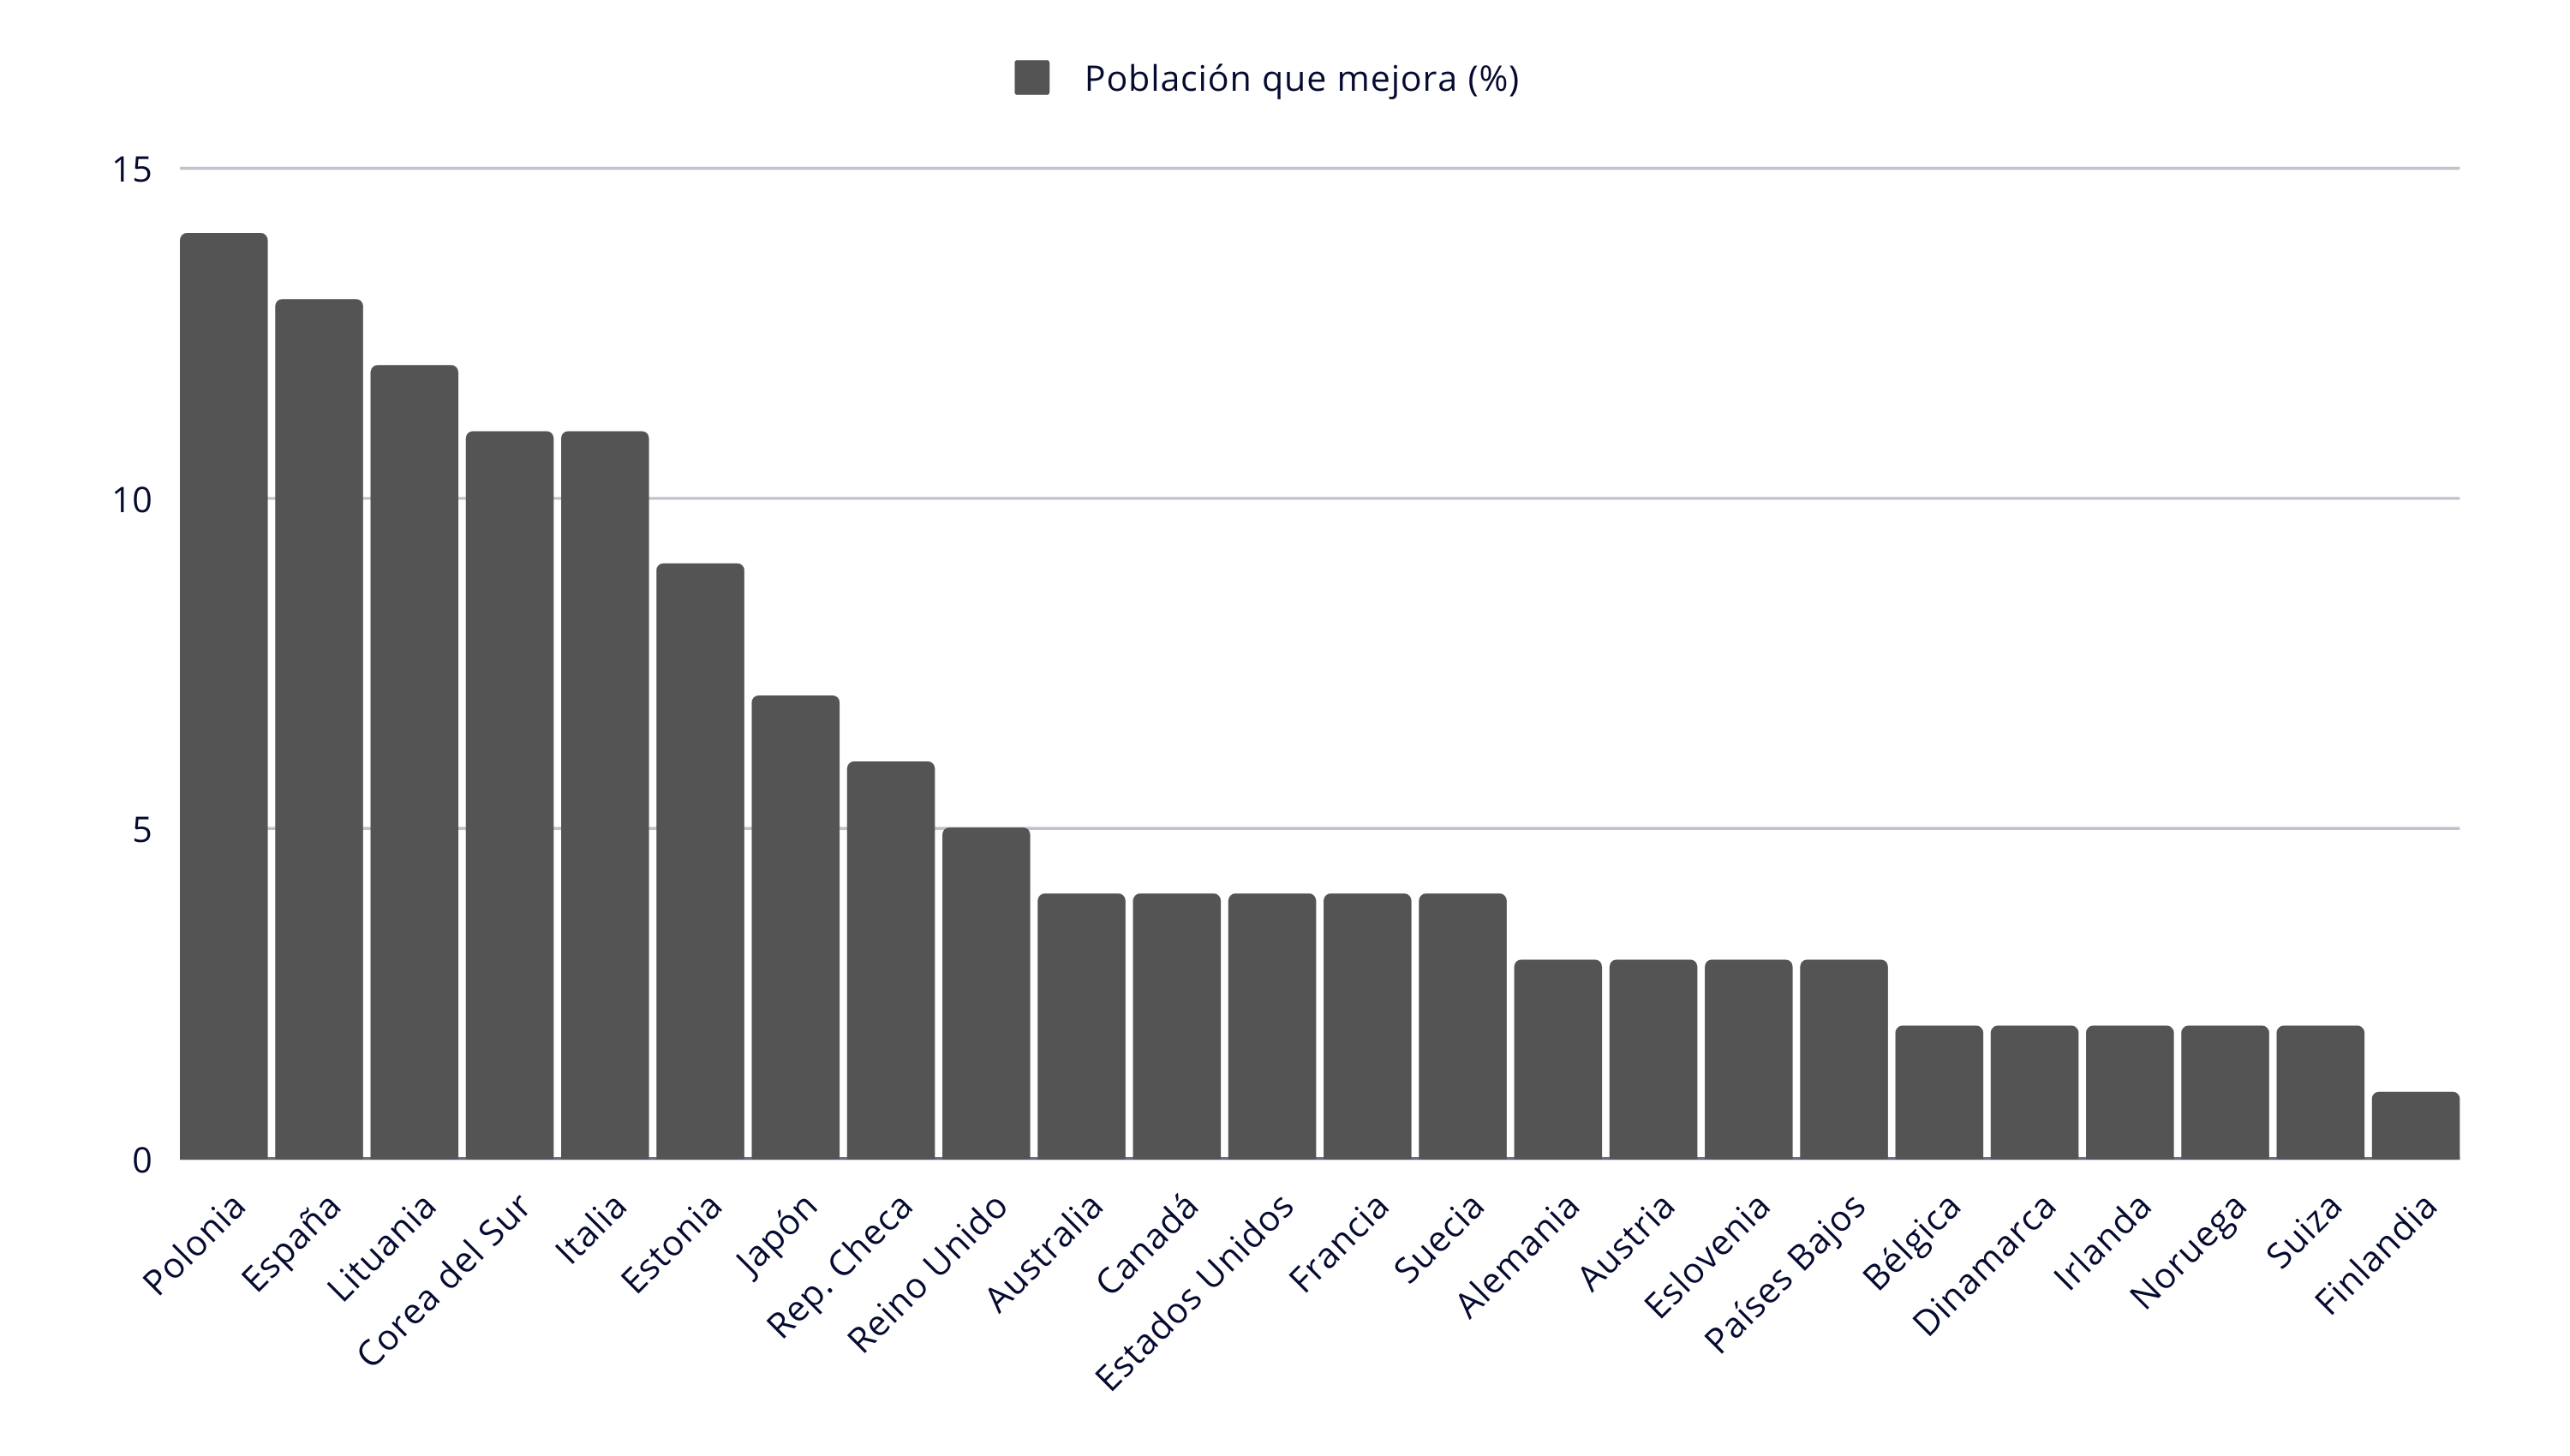
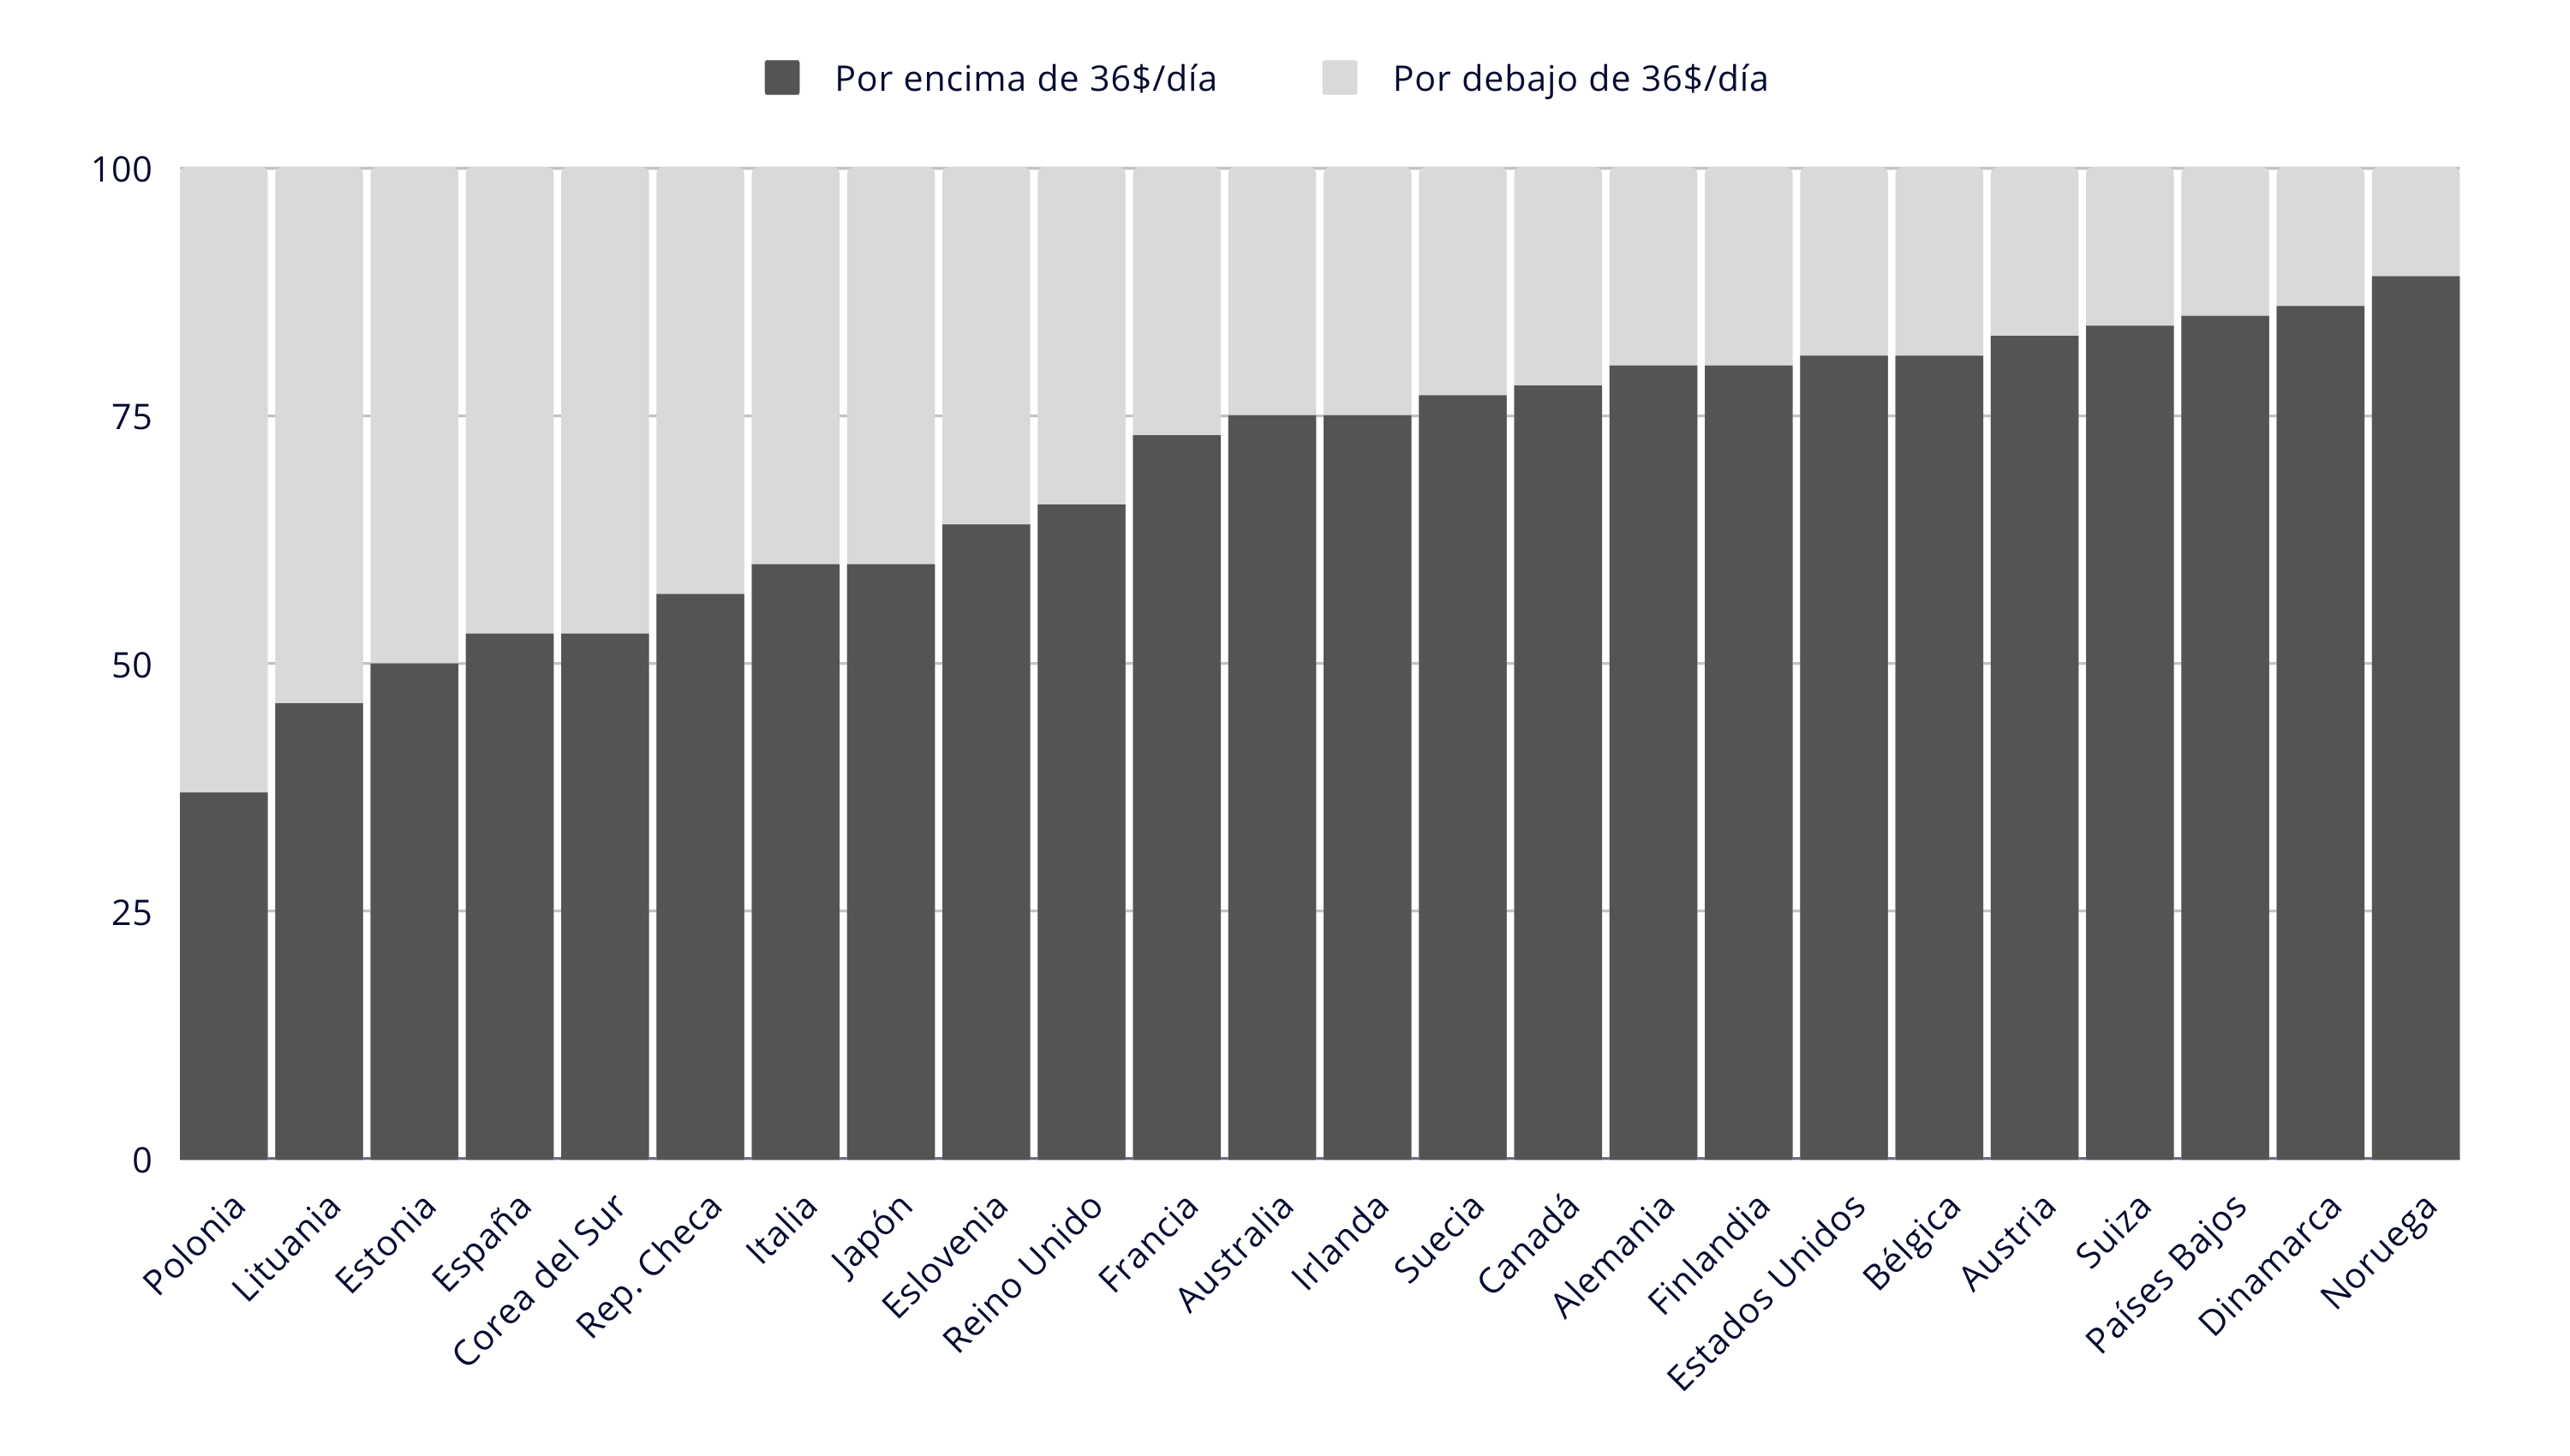 4. PERCENTAGE OF THE NATIONAL POPULATION ABOVE/BELOW TWICE THE WORLD AVERAGE INCOME OR CONSUMPTION
As we can see, with the exception of Estonia, Lithuania and Poland, all the other countries mentioned above have a demographic majority that enjoys a daily income more than double the world average. The proportion of this segment varies between 50-60% of the “semi-periphery” of the center (Spain, South Korea, Italy) and 75-90% of the hegemonic imperialist powers (France, Germany, United States). Therefore, if we take the level of income or consumption as an approximate measure of the standard of living, we must continue to conclude the same thing that Emmanuel concluded in 1976: most of the population of the rich countries are today, under prevailing international relations, better off than they would be tomorrow if, hypothetically, world socialism were implemented by decree.


The biggest and most important country in Latin America is intentionally and purposely left out, all of its 8.51 million km² with over 200 million population, the B in the BRICS, among the 10 major economies in the world!
Ideally, you would need a whole article dedicated to Brazil’s Economy/Society and how it differs from the poor North region to the rich South, with the South having welcomed waves of (self-entitled) European settlers that got the best arable land, with a diverse group of people, from agribusiness barons to workers and landless peasants’ movement, that clash in a violent class struggle.
Brazil endured 20 years of military dictatorship, that barely gets any mention in the global anti-imperialist press, with the exception of some dubious ‘journalists’ like Brian Mier and Glenn Greenwald, both from the imperialist ID politics and pseudo left.
I’m happy to watch the end of the empire and the rise of a multipolar world led by Socialist China, but this article is just lazy Economics.
If you would be willing to contribute a text about Brazil from the standpoint of world-systems analysis and/or unequal exchange, we would happily publish it.